Deep Learning 用 Python 進行深度學習的基礎理論實作 — 第一章 Python 入門
安裝 Python
- python 2.x 與 3.x 不相容,本書建議 3.x
- 使用兩套 library — NumPy、Matplotlib
- NumPy – 計算數值用的 library ,提供許多高難度數學演算法、陣列(矩陣)的方便方法
- Matplotlib – 繪圖用,將實驗結果視覺化
- 本書建議安裝 Python 的 Anaconda 套裝版本 (https://www.continuum.io/downloads)
- Anaconda 套裝版本已包含 NumPy 與 Matplotlib 兩套 library
安裝 Anaconda
- 無腦下一步即可完成安裝
python 相關語法
- 算數 : – + * / , 3**2 = 9
- type(10) => int , type(3.14) => float, type(“hello”) => string
- x = 10
print(x) - 清單 : a = [1,2,3,4,5]
len(a) => 5
a[0] => 1
a[4] = 99 => print(a) => [1,2,3,4,99]
a[0:2] => [1,2]
a[1:] => [2,3,4,99]
a[:3] => [1,2,3]
a[:-1] => [1,2,3,4] - 字典 : me = {‘height’:180}
me[‘height’] => 180
me[‘weight’] = 70 => print(me) => {‘height’:180, ‘weight’:70} - Boolean: hungry = True
not hungry => False - if else
if xxx:
do something
else:
do other thing - for
for i in [1,2,3]
print(i)
=> 1 2 3 - funtion
def hello():
print(“hello world!”)
hello()
=> hello world!def hello(object):
print(“hello ” + object +”!”)
hello(“cat”)
=> hello cat!
Python Script 檔案
- 建立 hungry.py 檔案,內容 print(“I’m hungry!”)
- >> python hungry.py
I’m hungry! - 類別 (class)
class 類別名稱:
def __init__(self, 參數, …): #建構子
…
def 方法名稱1(self, 參數, …): #方法1
…
def 方法名稱2(self, 參數, …): #方法2
… - 類別範例
 class Man:

def __init__(self, name):

self.name = name

print("Initilized!")

def hello(self):

print("Hello " + self.name + "!")

def goodbye(self):

print("Good-bye " + self.name + "!")

m = Man("David")

m.hello()

m.goodbye()
NumPy
NumPy 的陣列類別 (numpy.array),提供許多方便計算陣列或矩陣的方法。
把 numpy 當作 np 載入,之後使用 np 參照
>>> import numpy as np
產生 NumPy 陣列
>>> import numpy as np

>>> x = np.array([1.0, 2.0, 3.0])

>>> print(x)

[ 1. 2. 3.]

>>> type(x)

<class 'numpy.ndarray'>
>>> import numpy as np
>>> x = np.array([1.0, 2.0, 3.0])
>>> print(x)
[ 1. 2. 3.]
>>> type(x)
<class 'numpy.ndarray'>
NumPy 的算術運算
- x 與 y 的元素數量相同,都是數量為 3 的一維陣列
- x, y 的元素數量不同時會發生錯誤
- element-wise (對應元素)
- element-wise product (對應元素相乘)
>>> x = np.array([1.0, 2.0, 3.0])

>>> y = np.array([2.0, 4.0, 6.0])

>>> x + y

array([ 3., 6., 9.])

>>> x - y

array([-1., -2., -3.])

>>> x * y

array([ 2., 8., 18.])

>>> x / y

array([ 0.5, 0.5, 0.5])
NumPy 的 N 維陣列
- 數學中一維陣列叫做向量
- 二維陣列叫做矩陣
- 向量或矩陣,正規化後,叫做張量(tensor)
- 書中將二維陣列叫做矩陣,三維以上的陣列叫做張量或多維陣列
建立二維陣列(矩陣)
>>> A = np.array([[1, 2], [3, 4]])

>>> print(A)

[[1 2]

[3 4]]

>>> A.shape

(2, 2)

>>> A.dtype

dtype('int32')
矩陣算數運算
>>> A = np.array([[1, 2], [3, 4]])

>>> B = np.array([[3, 0], [0, 6]])

>>> A + B

array([[ 4, 2],

[ 3, 10]])

>>> A * B

array([[ 3, 0],

[ 0, 24]])
廣播 (broadcast)
NumPy 也可進行不同形狀的陣列運算,2×2 的陣列乘以純數 10,會將 10 擴大成 2×2 的陣列再計算,這就叫廣播 (broadcast)
兩個範例
>>> A = np.array([[1, 2], [3, 4]])

>>> print(A)

[[1 2]

[3 4]]

>>> A * 10

array([[10, 20],

[30, 40]])

>>>

>>>

>>>

>>> A = np.array([[1, 2], [3, 4]])

>>> B = np.array([10, 20])

>>> A * B

array([[10, 40],

[30, 80]])
存取元素
>>> x = np.array([[51, 55], [14, 19], [0, 4]])

>>> print(x)

[[51 55]

[14 19]

[ 0 4]]

>>> x[0]

array([51, 55])

>>> x[0][1]

55

>>>

>>>

>>> for row in x:

... print(row)

...

[51 55]

[14 19]

[0 4]
>>> print(x)
[[51 55]
[14 19]
[ 0 4]]
>>> x[0]
array([51, 55])
>>> x[0][1]
55
>>>
>>>
>>> for row in x:
... print(row)
...
[51 55]
[14 19]
[0 4]
利用陣列來存取元素
>>> x = x.flatten() #把x轉換成一維陣列

>>> print(x)

[51 55 14 19 0 4]

>>> x[np.array([0, 2, 4])] #索引值取得第0,2,4個元素

array([51, 14, 0])
上述方式可以單獨取出滿足條件的元素,例如 x 只取出 15 以上的值
>>> x > 15

array([ True, True, False, True, False, False], dtype=bool)

>>> x[x>15]

array([51, 55, 19])
Python這類動態語言的處理速度比不上靜態語言 C or C++,所以較大的處理,一般 Python 呼叫用 C or C++ 寫的程式來處理較大的工作,NumPy 的主要處理也是利用 C or C++ 來執行的。
Matplotlib
繪製單純的圖表
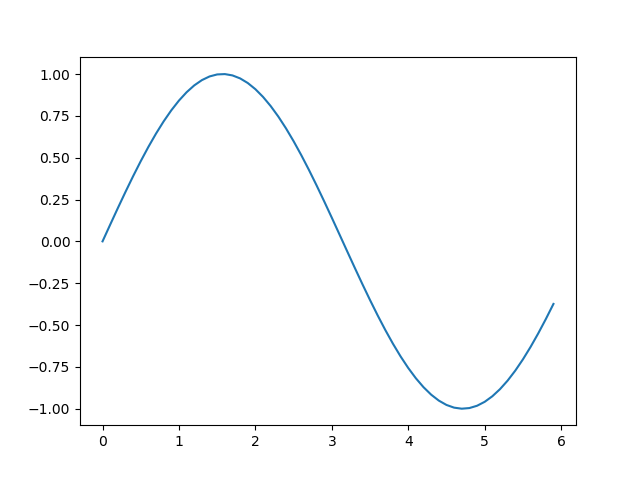
利用 matplotlib 的 pyplot 模組繪製 sin 函數
import numpy as np

import matplotlib.pyplot as plt

# 建立資料

x = np.arange(0, 6, 0.1) #從 0 到 6 以 0.1 為單位產生資料

y = np.sin(x)

#繪製圖表

plt.plot(x, y)

plt.show()
- 利用 NumPy 的 arange 方法,產生 [0, 0.1, 0.2, …, 5.8, 5.9] 等資料,當成 x
- 以 x 的元素為對象,套用 NumPy 的 sin 函數 np.sin()
- 提供 x, y 給 plt.plot,最後 plt.show()
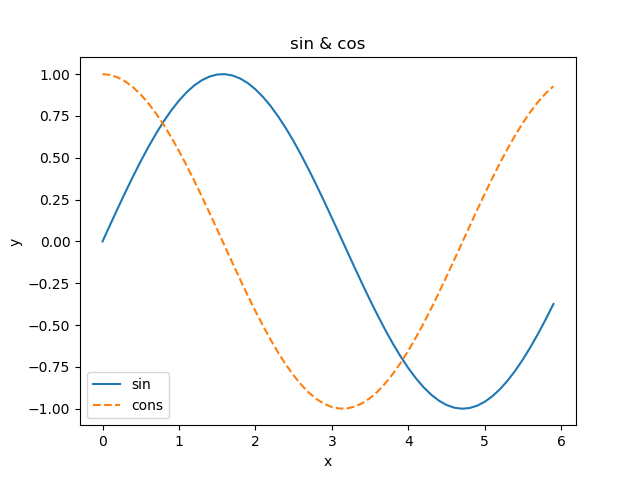
pyplot 的功能
import numpy as np

import matplotlib.pyplot as plt

# 建立資料

x = np.arange(0, 6, 0.1) #從 0 到 6 以 0.1 為單位產生資料

y1 = np.sin(x)

y2 = np.cos(x)

#繪製圖表

plt.plot(x, y1, label="sin")

plt.plot(x, y2, linestyle = "--", label="cons") #用虛線繪圖

plt.xlabel("x") #x軸標籤

plt.ylabel("y") #y軸標籤

plt.title('sin & cos') #標題

plt.legend()

plt.show()
import numpy as np
import matplotlib.pyplot as plt
# 建立資料
x = np.arange(0, 6, 0.1) #從 0 到 6 以 0.1 為單位產生資料
y1 = np.sin(x)
y2 = np.cos(x)
#繪製圖表
plt.plot(x, y1, label="sin")
plt.plot(x, y2, linestyle = "--", label="cons") #用虛線繪圖
plt.xlabel("x") #x軸標籤
plt.ylabel("y") #y軸標籤
plt.title('sin & cos') #標題
plt.legend()
plt.show()
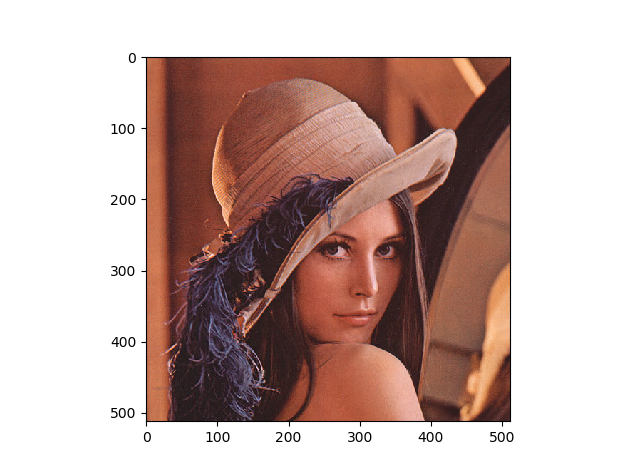
顯示影像
import matplotlib.pyplot as plt

from matplotlib.image import imread

img = imread('lena.png') #載入影像

plt.imshow(img)

plt.show()